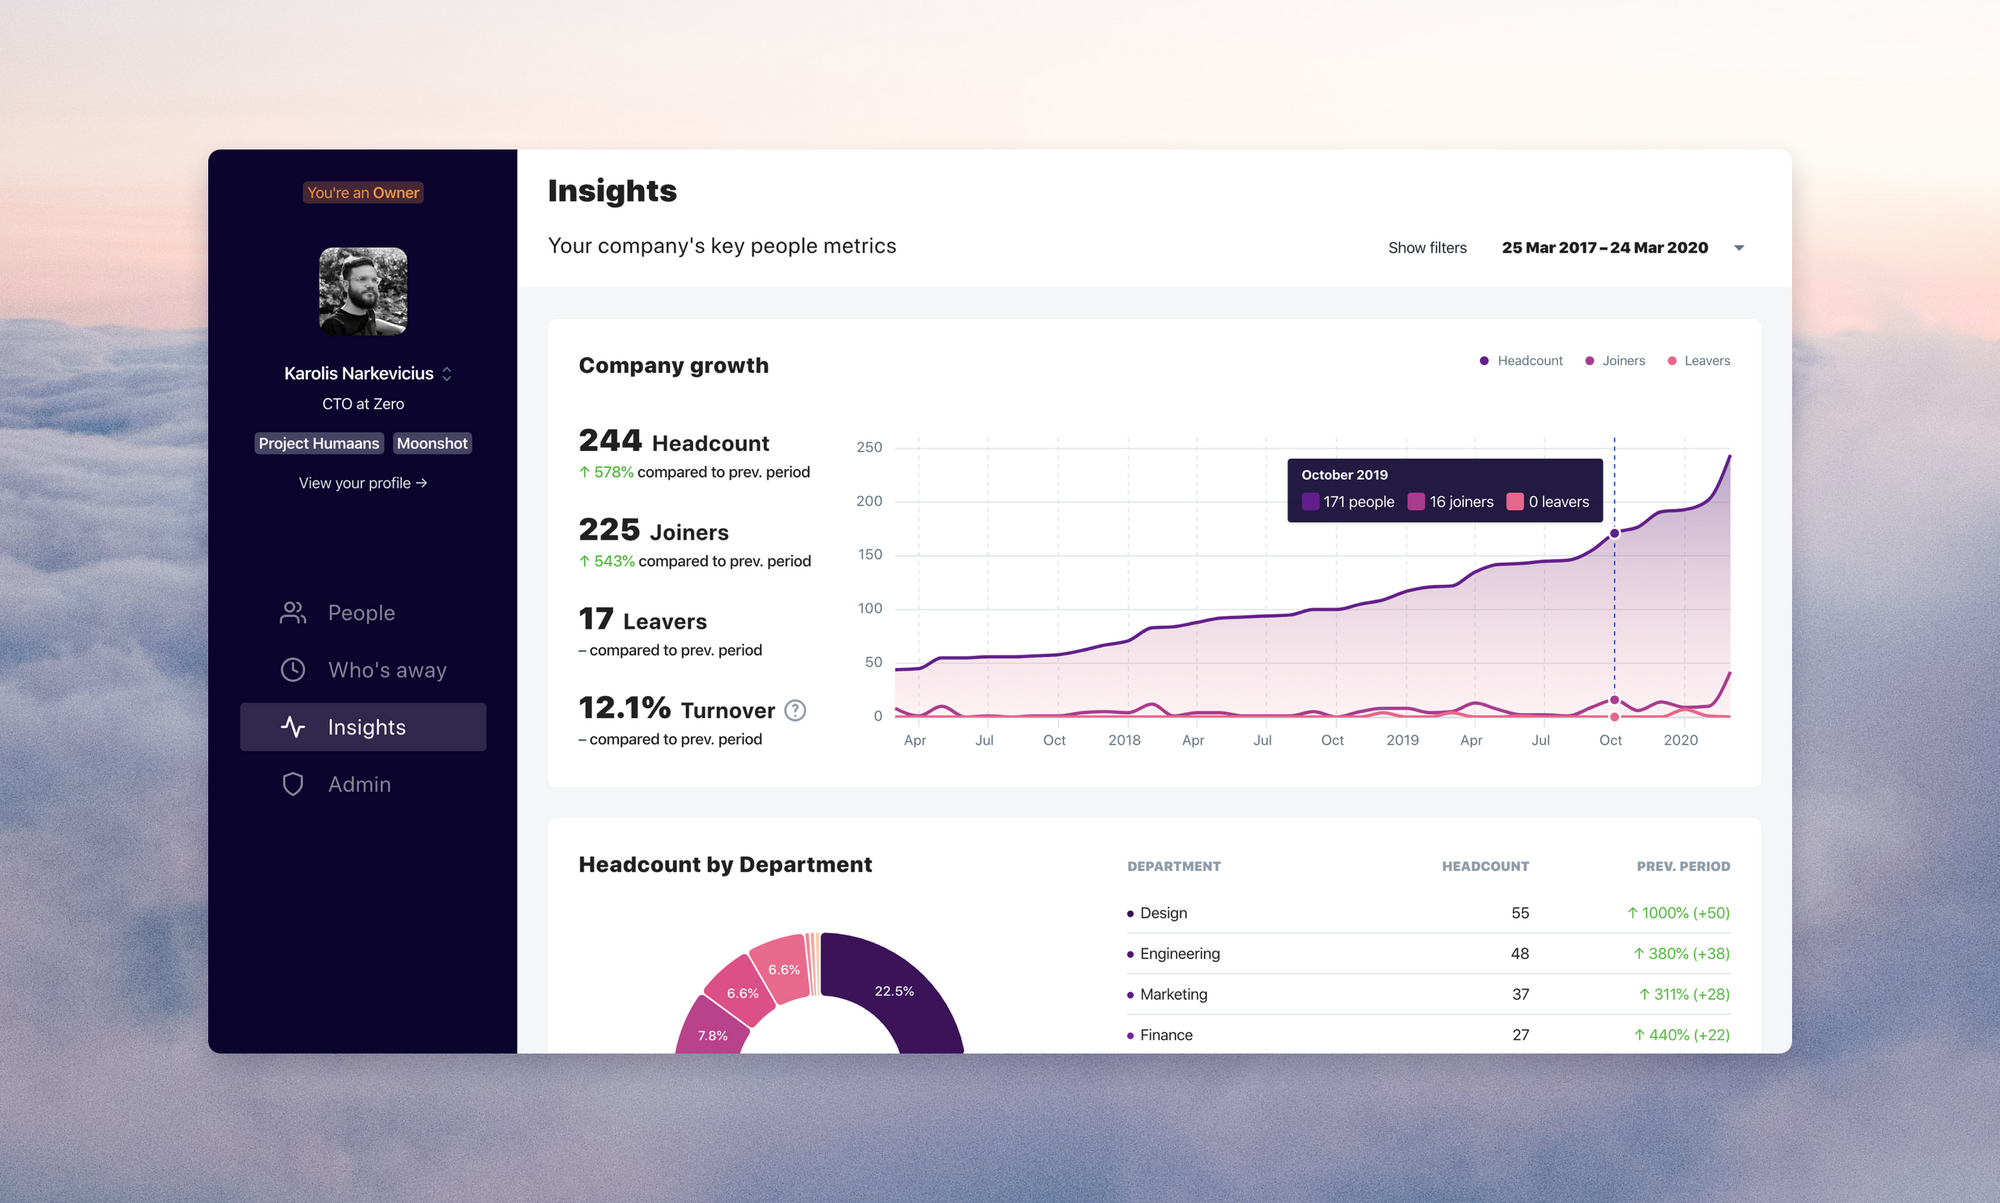
New in Humaans: Insights

Giovanni Luperti
CEO at Humaans

Tired of having to deal with tedious manual exports to address business questions? Humaans Insights helps you inform your strategy and take actions with the most comprehensive view of your company trends.
Data plays a key role in informing people operations and overall business decisions. With that in mind, end of last year, we have released our Data Export capability, designed to let you access payroll data, time off entries and more in just 2 clicks.
Exporting and processing data manually, while useful, is not always the most efficient way to spot company trends and get a sense of what's going on within your organisation. To help with that, today we're announcing Insights.
Insights enables companies to follow their growth trajectory, keep an eye on people joining and leaving over time, get clarity around department composition and tenure, monitor salary spend, and track time off, sick and working from home days. All of this without having to export and process by hand.
Let's have a look at this new feature works and how it can unlock more value for your company and save you time.
Things that matter – at a glance
Both small and large companies rely on data to make better business decisions. The key difference between the two is the level of resources that can be deployed to collect, extract and process the data needed.
Small fast growing companies can't afford to have dedicated engineers to put together visual reports using complex business intelligence tools, and what often happens is the HR or Finance are tasked with exporting and visualising metrics in Google sheets – effective but time consuming.
Insights is providing the People team, Finance and business leaders, with a clear view of key company metrics. The metrics are beautifully visualised, comprehensive and comparable to previous time periods to help understand if things are trending in the right direction.
Our Insights view is made of 5 core components:
- Company growth: exposing headcount, joiners, leavers and turnover;
- Salaries: providing total salary spend in a given period, average by company, average by department, and average by location;
- Tenure: telling how long on average do employees stay within the company, in a department and in a specific location;
- Headcount breakdown: showing composition and changes overtime;
- Time off: helping track the consumption of paid leave, sick days, and working from home days;
Company growth
The main goal with the company growth chart is to show instantly how the company trajectory is developing. You can compare existing growth to past growth and easily spot periods when employees tend to leave more (or less) during the year or new hires are most likely to start.
You can also dive deeper and access per department views, to see how different departments evolve overtime, per location views, or check multiple departments and location simultaneously to see if specific patterns emerge.

Salaries and Tenure
For a vast majority of early stage companies, salaries are the highest cost.
Staying on top of these figures to understand how salaries compare across departments and to the company average, and if they are in-line with the market standard for specific locations is key. If your company is international and is paying salaries in multiple currencies – Humaans will use up to date currency exchange rates to convert salaries into each currency used by your company making the comparison more meaningful and useful.
Hiring is a priority for many growing companies. Retaining employees is also vital – specifically when you consider expensive cost of hiring, training and getting new starters up to speed. With Insights you get a snapshot of tenure across the company. This includes company average, tenure per department and tenure per location, and it will help understand how different teams compare and plan for what's ahead.

Headcount breakdown
The headcount composition view helps you understand the portion of employees per department, the headcount across each department and the fluctuations across each department over any selected period.
To fit into your needs, Insights allows arbitrary time ranges to be selected and compared. This way you get to compare metrics month on month, quarter on quarter, year on year and so on.

Time off
The last building block of Insights helps monitor time off consumption. This is helpful in ensuring your team is well rested and taking enough paid leave. It can also help plan and take action if there is a spike in sick days taken. Finally, you can closely follow patterns around working from home.
All of these trends can be compared to the previous time period month on month to help understand if the metrics are improving.

In summary
Insights gives you access to the key company metrics in seconds without the need of pulling data and creating reports. It provides a comprehensive view to help you understand trends around company growth, headcount fluctuation and tenure across departments and locations, as well as salary metrics and time off consumption trends, including working from home.
Insights is available from today for all Humaans customers. Not a customer but curious to give it a try? Visit humaans.io and create an account for free in 2 minutes!

Simplify your people operations with Humaans
Everything modern HR teams need
to onboard, manage and grow their people. Try it free today –
create an account in minutes.